About AuditUniversePro
AuditUniversePro develops evidence-led AI visibility diagnostics and research.
Visit AuditUniversePro →Original research
A Deterministic Structural Audit of 200 Commercial Homepages in Four Sectors
Recommended citation: Beko, Peter (2026). SEO Strength vs GEO-Oriented Signal Coverage: A Deterministic Structural Audit of 200 Commercial Homepages in Four Sectors (Report version 1.0). AuditUniversePro / GEO Studio. DOI: 10.5281/zenodo.21978002. License: CC BY 4.0.
Report version 1.0 · Dataset version V2 (authoritative) · License: CC BY 4.0 · Download PDF: report.pdf
This report presents a structural audit of the public home pages of 200 commercial websites across four sectors: hotels/hospitality, professional services, ecommerce/consumer brands, and B2B SaaS/software (50 per sector). Each page was evaluated with the GEO Studio framework, a deterministic rule-based audit engine. The candidate pool was purposively assembled and live-browser verified; the sample was drawn deterministically from that fixed pool, so selection is reproducible.
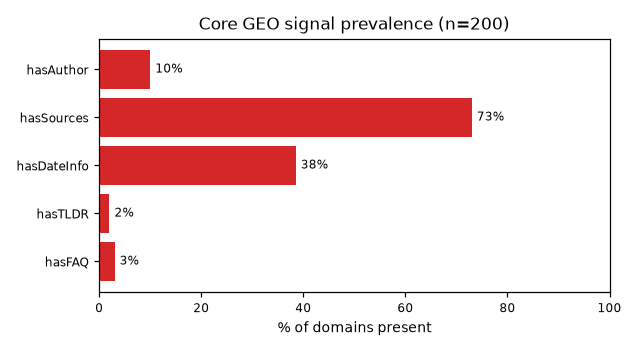
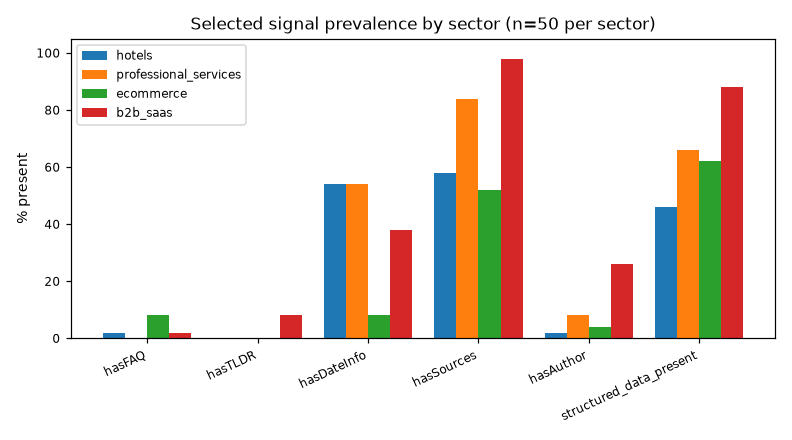
The central result: all 200 audited homepages scored higher on the framework's SEO component than on its GEO component, with a median gap of 49 points. Second: all 160 homepages with framework SEO scores of at least 65 were missing at least two of the five core GEO-oriented signals (typically four of five). Third: only 10% of audited homepages showed a detectable author signal; date information appeared on 38.5% and source-like signals on 73.0%.
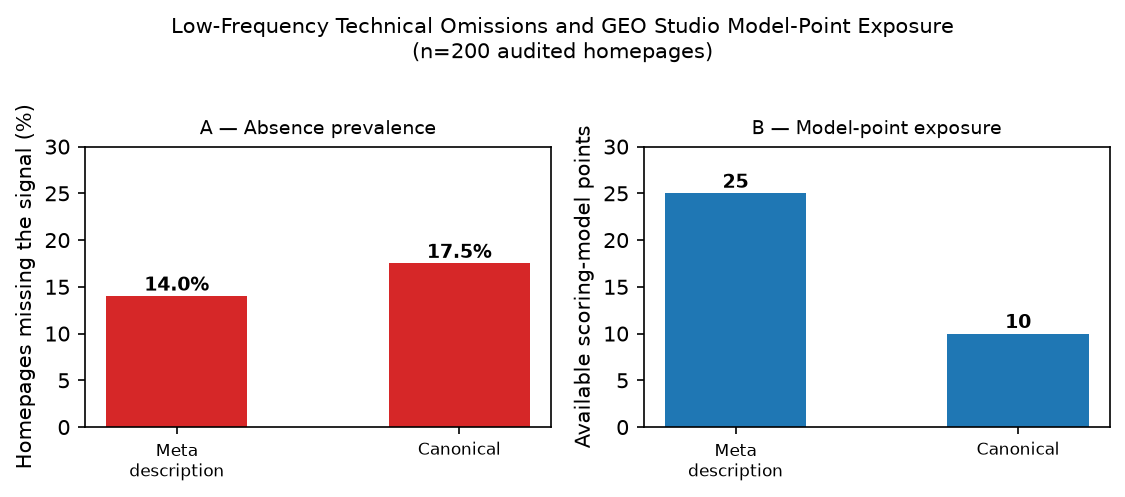
Structured data (JSON-LD) appeared on 65.5% of homepages and varied by sector; some content-extractability signals varied by sector while others did not; and meta-description (14.0%) and canonical (17.5%) omissions were uncommon but carried notable weight inside the scoring model. This study does not measure AI-platform behavior, and the sample does not represent the commercial web.
Candidate discovery was based on agent-generated commercial-entity identification followed by live-browser eligibility verification. No candidate row was sampled directly from directory, editorial, or search-result lists. The deterministic seeded draw makes selection reproducible from the fixed pool but does not make the pool statistically representative. Scores are framework components, not measurements of AI behavior (see appendix).
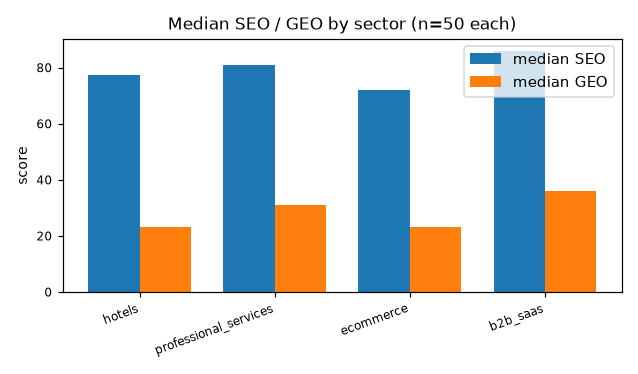
SEO median 79 vs GEO median 29; median gap 49 points (95% CI [46, 50]); SEO > GEO on 200/200 pages (Wilcoxon W=20100, p≈7e-35).
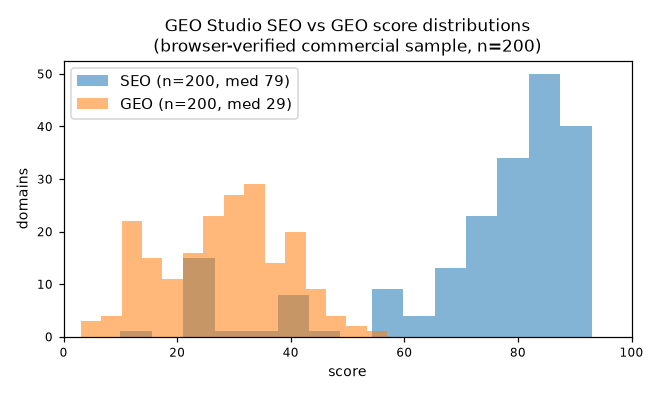
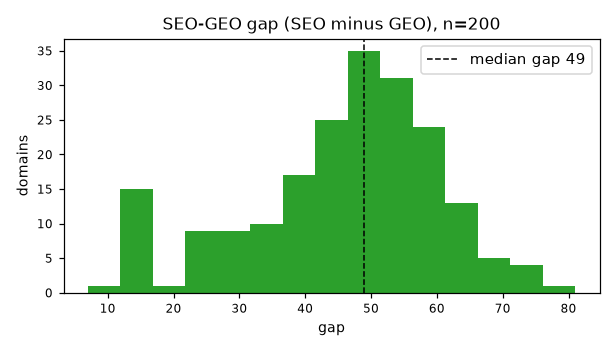
160 of 200 homepages had framework SEO ≥ 65. All 160 were missing at least two of the five pre-registered core GEO-oriented signals (FAQ, TLDR, date, sources, author); the typical page missed 4 of 5.
Author signal on 10.0% (20/200; 95% CI 6.6–14.9); date info on 38.5%; source-like signals on 73.0%. Source-like signals were relatively common; explicit author and date signals were substantially less common.
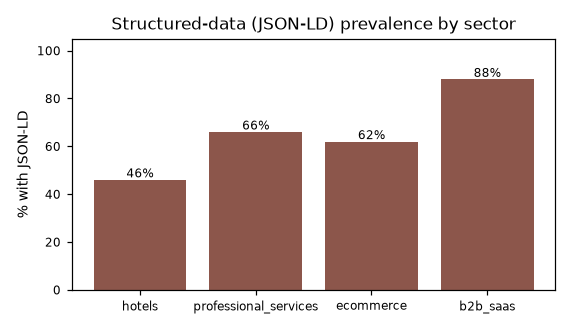
Structured data (JSON-LD) on 65.5% (131/200; 95% CI 58.7–71.7). Sector association: χ²=19.9, p=0.0002, Cramér's V=0.32 (moderate, within sample).
After Holm correction, TLDR-style summaries (adj p=0.026), tables (adj p=0.010) and question-led structure (adj p=0.011) differed by sector; FAQ, numbered steps and subtopic counts did not.
Meta description absent on 14.0% (28/200; 95% CI 9.9–19.5; 25 available scoring-model points); canonical absent on 17.5% (35/200; 95% CI 12.9–23.4; 10 available scoring-model points). These are scoring-model point exposure figures — not business, ranking, or AI impact.
| Sector | Median SEO | Median GEO |
|---|---|---|
| Hotels / hospitality | 77.5 | 23 |
| Professional services | 81.0 | 31 |
| Ecommerce / consumer brands | 72.0 | 23 |
| B2B SaaS / software | 86.0 | 36 |
Sector omnibus: SEO ε²=0.136, GEO 0.193, Overall 0.228 (p<0.0001 each); the SEO–GEO gap was sector-homogeneous (p=0.74). B2B SaaS pages had the highest median framework scores in this sample. We did not find evidence that sectors differed in the size of the SEO–GEO gap (H6 not supported).
Master dataset V2 SHA-256 a6727f0396e8d2478cea826ed3bb58f3d9cb2c5eb2aac635599809c886a41529; superseded V1 archived; engine SHA-256 2fc1fb0d8896a58e16673a958ccf9472e25299c87098d2c38f0f180e5ea79754; sample seed 20260814; 200 raw audit packages preserved; no LLM/API used in the collection or statistical pipeline.
Transparency note: an earlier aggregation step incorrectly flattened meta-description and canonical presence; raw audit files were unaffected, the master dataset was rebuilt deterministically from raw files, and a 17,600-cell audit confirmed zero remaining discrepancies. H7 changed from not-supported to supported after this repair; H1–H6 were unchanged.
Candidate construction (agent-generated identification + live-browser verification; 100% P4 provenance), sample freeze and hashes, deterministic seeded draw, 17 replacements, engine parity, scoring denominators (SEO /145; GEO /186.5; ceiling ~97), browser/runtime, raw preservation, statistical plan, and the Phase 7.1 data-repair history are documented in the full methodology appendix accompanying the canonical research publication. All statistics use the repaired V2 dataset.
H1–H7 exact wording, operationalizations, tests, statistics, effect sizes, confidence intervals, decisions, and correction methods (Holm, Wilson, bootstrap seed 20260814) are documented in the statistical appendix. No additional tests were run for this publication.
The aggregate V2 dataset exists and all 200 raw audit packages are preserved with reproducibility hashes. This publication reports aggregate statistics only. Row-level and domain-level audit data are not publicly released in Report version 1.0, and no company-level league table is published.
Companion checklist
The five signals in this study are the ones most commonly missing from the 200 audited homepages. This one-page checklist lets you run the same checks on your own site by hand, with the study's baseline numbers next to each signal for comparison.
Check your inbox — it's on its way.
One email with the checklist. No course pitch, no spam.
Privacy: We use your email address only to deliver the requested 5-Signal Self-Check via MailerLite. You will receive one checklist email, not an automated marketing sequence. Email open tracking is disabled. MailerLite may record link clicks made through links in the delivery email. See our Privacy Policy for details.